benchmarks
Latest

Facebook, Google and others come together to set benchmarks for AI
A consortium of 40 tech companies, including the likes of Facebook and Google, have come together to release a set of evaluation benchmarks for AI. By measuring AI products against these benchmarks, companies in the field will be able to identify optimal product solutions and, according to the consortium, MLPerf, "take confidence" that they're deploying the right solutions.

Oppo is the latest to be caught cheating on phone benchmarks
You can add another big name to the list of phone makers found cheating on benchmarks. UL Benchmarks has delisted Oppo's Find X and F7 phones from its 3DMark charts after testing from itself and Tech2 revealed that both devices were artificially ramping up processor performance when they detected the test by name. Oppo acknowledged that it always stepped things up when it detected "games or 3D Benchmarks that required high performance," but claimed that any app would run full bore if you tapped on the screen every few seconds to signal your actions.

Huawei was caught cheating on phone benchmarks (updated)
You'd think smartphone manufacturers would have learned their lesson after being caught cheating multiple times, but that's apparently not the case. UL Benchmarks (aka the Futuremark team) has delisted Huawei's P20 Pro, P20, Nova 3 and Honor Play from 3DMark's charts after internal testing and an AnandTech exposé showed the devices ramping up performance whenever they detected the public versions of benchmarking apps. These were not subtle differences, either, with results up to 47 percent higher than they were with private test variants Huawei couldn't catch.

Qualcomm's flagship Snapdragon 845 is a graphics powerhouse
Qualcomm recently let journalists benchmark the upcoming Snapdragon 845 on its own reference smartphone, and the results look promising for the Galaxy S9 and other new devices. On the one hand, CPU improvements were merely incremental, despite a switch to new ARM Cortex designs. On the other, Qualcomm's new Adreno 630 GPU performed impressively, especially considering the power draw, putting rivals like Samsung and Huawei on notice. "There is need for more radical change to keep up with Qualcomm," said Anandtech.

VRMark will tell you if your PC is ready for Virtual Reality
Oculus and Valve's own virtual reality compatibility tests will tell you if your PC is VR-ready, but how ready is a bit of a specification guessing game. Will you be able to run games at their maximum settings, or are you just going to scrape past virtual reality's minimum requirements? Futuremark's trying to make that question easier to answer with a new benchmarking suite designed specifically for virtual reality.

Smartphone chips are about to get better at gaming, Twitter and Netflix
There's been a lot of talk about how phones from certain manufacturers can sense when you're running benchmarking software and will artificially inflate their performance accordingly. It's been a problem for some time now, but the industry appears to be finding its own ways of dealing with the issue. ARM, the outfit that designs the bulk of the smartphone industry's chips, has teamed up with British startup GameBench to make benchmarks not only more honest, but also a lot more understandable.

Samsung lawsuit claims that NVIDIA's benchmarks are misleading
Samsung definitely isn't taking NVIDIA's first patent lawsuit lying down. The Korean tech firm has countersued NVIDIA not just for allegedly infringing on six patents, but for leading buyers astray with benchmarks for the Shield Tablet. NVIDIA is supposedly trying to "confuse customers" by claiming that the slate's Tegra K1 processor outpaces the Exynos 5433 chip in the Galaxy Note 4; regular benchmarks show that's not true, Samsung claims. The suit also accuses PC vendor Velocity Micro of violating two additional patents (for a total of eight), since NVIDIA's graphics cards play a heavy role in its lineup.

Benchmarking LaCie's speedy Rugged USB 3.0 Thunderbolt SSD drive
LaCie's been supplying Mac users with drives since 1987, but the company's still able to surprise and delight the Mac community with new and innovative products. One that I had been looking forward to testing just showed up at the office -- the new LaCie Rugged USB 3.0 Thunderbolt SSD (starting at $199 for SSD models). The model I tested was the $499.99 500 GB SSD model, and I'm pleased to say that it actually surpassed the advertised speeds in benchmark testing. Specifications Capacity: SSD -- 120 ($199.99), 256 ($299.99), 500 GB ($499.99) HD - 1 ($199.99 street price), 2 TB ($349.99 street price) Interface: 1 Thunderbolt port (with built-in cable), 1 USB 3.0 port (USB 2.0 compatible) HD rotational speed: 5,400 RPM SSD Type: SATA 6 Gb/s Average Transfer Rate: (USB 3.0 and Thunderbolt) SSD - 385 MB/s, HD - 110 MB/s Drop height: 4 feet/1.2 meters (in non-operating mode) Dimensions: 3.5 x 5.5 x 0.97 in. (89 x 140 x 24 mm) Weight: 9.2 oz. (260 grams) Included: USB 3.0 cable, Thunderbolt cable (0.5 m, integrated), software Bus powered Design Highlights LaCie has a history of making external drives look good. In the case of the Rugged, form follows function and the drive is encased in a thick orange silicone bumper to protect from drops and falls. Designer Neil Poulton smartly included an integrated Thunderbolt cable that fits into a groove around the middle of the bumper, with a silicone "door" that holds the end of the cable in place and covers the bare USB 3.0 port. The Rugged drive is designed to take a 4 foot drop in non-operating mode, meaning that the HD version is unplugged, the platters have "spun down," and the drive heads are retracted. No such restriction for the SSD version, of course, as it has no moving parts. However, you still want to take care to keep accidental drops to less than 4 feet. Benchmarks Sad to say, we don't have any single Thunderbolt SSD drive benchmarks run on our standard tool (QuickBench) to compare the Rugged drive to. But let's just say that it's fast -- very fast. As a comparison, I have added results for the G-Technology G-DOCK ev, which is a Thunderbolt 2-drive RAID setup. It's not exactly a straight comparison, but it should give you an idea of just how speedy this little portable drive is. For the purposes of testing external drives and RAID arrays, we traditionally use the Intech SpeedTools QuickBench 4.0 app to run multiple cycles of read/write tests. The Rugged was directly connected to a MacBook Pro with Retina display using the built-in Thunderbolt cable. To ensure accuracy in testing, I performed a 100-cycle complete test. This subjects the drive to sequential and random read and write tests with file sizes from 4K to 100 MB, then graphically or textually displays that information to show the "sweet spots" for a specific drive or array. For example, if your work involves shuffling around a lot of very large files, you'll probably want a drive that has peak read/write speeds for files around your average file size. Here are the test results, compared to the G-DOCK ev set up as a RAID 0 volume: Sequential Read: 206.553 MB/Sec (189.675 MB/Sec for G-Dock ev via Thunderbolt) Sequential Write: 188.524 MB/Sec (197.831 MB/Sec for G-Dock ev via Thunderbolt) Random Read: 174.414 MB/Sec (22.432 MB/Sec for G-Dock ev via Thunderbolt) Random Write: 169.066 MB/Sec (38.360 MB/Sec for G-Dock ev via Thunderbolt) Large Read: 380.365 MB/Sec (272.062 MB/Sec for G-Dock ev via Thunderbolt) Large Write: 353.494 MB/Sec (262.744 MB/Sec for G-Dock ev via Thunderbolt) Extended Read: 391.315 MB/Sec (266.927 MB/Sec for G-Dock ev via Thunderbolt) Extended Write: 362.019 MB/Sec (264.170 MB/Sec for G-Dock ev via Thunderbolt) This thing cooks! That extended read rate of 391.315 MB/sec is better than the advertised rate of 385 MB/sec. As you'd expect, being an SSD, the Rugged USB 3.0 Thunderbolt SSD is completely silent in operation. Conclusion Portability? Check. Rugged design? Check. SSD speed? Check. Bus-powered? Check. Thunderbolt and USB 3.0? Check. Built-in Thunderbolt cable? Check. The only negative for the LaCie Rugged USB 3.0 Thunderbolt SSD is the price tag. A bare 500 GB SSD drive runs as low as $200 through online, but you'll be hard-pressed to find a small enclosure that has both Thunderbolt and USB 3.0 interfaces. So if you need a fast, ruggedized, bus-powered drive with half a terabyte of storage and blazing speed, the LaCie Rugged USB 3.0 Thunderbolt SSD is going to be your absolute best bet at this time. Rating: 4 stars out of 4 stars possible

Samsung devices no longer boosting benchmark scores after Android 4.4 update
Those artificially inflated benchmark scores Samsung devices were getting last year? They've been patched. According to new tests run by Ars Technica, Samsung devices running Android 4.4 no longer boost CPU speeds during benchmark tests. In July, Exynos variants of the Galaxy S 4 and Note 3 were caught running their CPUs at an unsustainable max speed during benchmark programs, bolstering their total score by as much as 20 percent. Samsung suggested this was normal, claiming that varied processor frequencies were designed to provide an "optimal user experience." The firm never clearly explained if the phenomenon was a feature, fault or foul play, but it's over now: Devices updated to the latest version of Android are apparently running clean.

ioSafe 214 NAS: Keeping data safe from fire, water, and drive failures
ioSafe has been around for a while, making mass storage devices that can survive fires and floods -- you know, the things that do happen to people and destroy their usual inexpensive backup hard drives. Lately ioSafe has teamed with Synology to add that company's DiskStation Manager (DSM) to a pair of network-attached storage (NAS) products that can withstand catastrophes, and today I'm looking at the ioSafe 214 NAS, a dual-drive disaster-proof solution. Specifications Price: US$899.99 (as configured). Pricing of other configurations available here. Dimensions: 5.9 in (150mm) x 9.06 in (230mm) x 11.5 in (292mm) Weight: 28 pounds (12.7 kilograms) Power: 100 to 240V, 50-60Hz single phase, 18.48 W (accessing data); 8.28 W (hibernating) Interface: Gigabit Ethernet, two USB 3.0 ports, one USB 2.0 port (Wi-Fi can be enabled by using a USB dongle) Maximum Capacity: 8 TB (two 4 TB HDD), usable 4 TB RAID 1 Capacity As Tested: 916 GB (two 1 TB HDD in RAID 1 configuration) Fire Protection: Up to 1550°F, 30 minutes per ASTM E-119 Flood Protection: Fully submersed, fresh or salt water, 10 foot depth, 72 hours Theft Protection: Kensington security slot and optional floor mount with padlock Drives: Two 3.5" or 2.5" SATA(II), hot-swappable Design Highlights The biggest selling point of the ioSafe 214 is the survivability of the NAS in case of a fire. This array is designed to pretty much survive a fire in a business as well as the inundation that you'd expect from firefighters trying to put out that fire. Even if the NAS is damaged, ioSafe provides a Data Recovery Service that pays for shipping, attempting recovery of data, and then spends up to $2500 ($5000 for businesses) per terabyte of data for forensic recovery. After that, they'll send the recovered data back to you on "replacement product." For pro-sumers or businesses, this is hefty insurance for your precious data. The NAS is heavy -- 28 pounds -- and taking off the front cover of the device with the included tool illustrates why. The interior and the "door" are lined with a thick ceramic material to provide the necessary protection from fire. Inside are two drives; ioSafe notes that they can be either 3.5 or 2.5 inch drives. Functionality Highlights The next big feature set of the ioSafe 214 is the Synology DSM implementation. You're not just buying a NAS when you get this box -- instead, you're getting what is essentially a full file server. Synology DSM adds File Station for sharing and managing files, Photo Station (online photo album plus blog), Antivirus Essential Server, Directory Server (LDAP service with access control and authentication for business users), iTunes Server, Surveillance Station (can manage IP cameras to guard your business), Video Station (for browsing and organizing video content), Media Server (to add TV sets and stereos to the network for watching stored media), Cloud Station (file sharing like Dropbox, without the monthly fee), Audio Station (web-based audio app), Download Station (web-based download app), Mail Station (webmail service), Time Backup (backing up ioSafe data with versioning), VPN Server (turns your device into a VPN server). If that's not enough, you can also download other applications from Synology. I used to be an Apple Consultants Network member and received certification in OS X Server. I wish I had known about Synology DSM and the ioSafe 214 back in those days, because I would have passed on using and supporting OS X Server. Seriously, from taking the ioSafe 214 out of the box to setting up a user for benchmarking took me only about 3 minutes. That user was set up with Mac, Windows, and NFS file services immediately, full FTP and WebDAV access, etc... Synology DSM is set up from a web-based control panel that is both incredibly easy to use and filled with power. Note to Apple: you've already departed the server hardware business, now get out of the server OS biz. For the purposes of my testing, which is more about using the ioSafe 214 as a fast, network-attached storage device instead of as a full file server, I am going to concentrate on the benchmarks. But I seriously recommend that any small business that is considering setting up a server consider this device with Synology DSM instead of OS X Server. Not only do you get mass storage that is capable of handling the worst disasters that you can imagine, but it also provides all of the services of OS X Server without any of the setup and support hassles. Benchmarks For the purposes of testing external drives and RAID arrays, we traditionally use the Intech SpeedTools QuickBench 4.0 app to run multiple cycles of read/write tests. In this case, both the Mac that was running QuickBench (MacBook Pro with Retina display) and the array were connected via Gigabit Ethernet. The MacBook Pro was using an Apple Thunderbolt to Gigabit Ethernet adapter; the ioSafe 214 has built-in Gigabit Ethernet; and the two were connected via a Linksys Gigabit Ethernet router. To ensure accuracy in testing, I performed a 100-cycle complete test. This subjects the drive to sequential and random read and write tests with file sizes from 4K to 100 MB, then graphically or textually displays that information to show the "sweet spots" for a specific drive or array. For example, if your work involves shuffling around a lot of very large files, you'll probably want a drive that has peak read/write speeds for files around your average file size. Here are the test results, with a comparison to the Drobo 5N NAS that we reviewed recently: Sequential Read: 54.578 MB/Sec (48.452 MB/Sec for Drobo 5N) Sequential Write: 47.910 MB/Sec (12.398 MB/Sec for Drobo 5N) Random Read: 57.856 MB/Sec (51.344 MB/Sec for Drobo 5N) Random Write: 45.936 MB/Sec (21.866 MB/Sec for Drobo 5N) Large Read: 110.466 MB/Sec (109.947 MB/Sec for Drobo 5N) Large Write: 109.567 MB/Sec (71.205 MB/Sec for Drobo 5N) Extended Read: 107.834 MB/Sec (107.690 MB/Sec for Drobo 5N) Extended Write: 64.963 MB/Sec (46.833 MB/Sec for Drobo 5N) Compared to the competing Drobo 5N, the ioSafe 214 was faster at write speeds across the board. Read speeds were slightly faster for smaller file sizes, and almost identical for large and very large files sizes. Conclusion For a small business looking for a way to provide shared storage to a group of employees, the ioSafe 214 NAS would be a good solution. Add the fireproof and waterproof design and the amazing Data Recovery Service, and you'd have an excellent small business storage solution. What makes the ioSafe 214 NAS a must-buy for small businesses is the integration of Synology DSM. I'm also impressed with the pricing, which ranges from $899 for a 214 NAS with two 1 TB drives to $1,999 for the same unit with two 4 TB drives. While that may not seem like a bargain, consider what you'd spend trying to recover data from a hard drive destroyed by a fire or flood. Not only will the ioSafe 214 NAS have a better chance of surviving a catastrophe, but even if it doesn't the company's included Data Recovery Service has a very good chance of making sure at least some of your data is returned to you. A year of DRS is included in the base price of the device, and additional years of coverage are reasonably priced. But this is more than just a ruggedized NAS -- the ioSafe 214 NAS is a powerful server that can provide all of the capabilities that a small business needs, without the hassle of confusing or complicated setup. If I was still an Apple consultant, I know that I'd be recommending the ioSafe 214 NAS or its larger brother (the ioSafe 1513+ NAS) to my small business clients without hesitation. As a tech reviewer, I can definitely recommend this product. Rating: 4 stars out of 4 stars possible

Early benchmarks suggest NVIDIA's new Tegra chip outperforms Apple and Qualcomm
The graph above comes courtesy of Tom's Hardware and, whichever way you look it, it suggests NVIDIA is onto a good thing. The company's recently announced Tegra K1 processor combines a handful of ARM Cortex-A15 CPUs with a GPU based on the same successful Kepler graphics architecture found in desktops and laptops. The result seems to be a minimum 25 percent lead over the current generation of flagship chips, including Qualcomm's Snapdragon 800 and Apple's 64-bit A7, as measured with 3DMark -- although this may not be an especially fair comparison since we don't know the precise wattage of the Thinkvision's processor (if it's more than a few watts, it shouldn't really be compared to the chip in a smartphone). You'll find a roughly similar pattern in other tests over at the source link, but before you disappear into a new tab here's a couple more disclaimers: Firstly, these scores are based on a Lenovo Thinkvision 28 Android all-in-one (with a lovely 4K panel), which Tom's Hardware was led to believe (but not officially told) contains a K1. Secondly, assuming this is a K1, it's definitely not the 64-bit version; it's not running at NVIDIA's claimed max clock speed of 2.3GHz, and it's almost certainly not using market-ready drivers -- all of which suggests that 2014's crop of Tegra K1-powered tablets could be even more powerful than what we're seeing right now. Update: More benchmark scores are spilling out. They still only relate to graphics, and they rely on a pre-release version of GFXBench, but these numbers would suggest that a Tegra K1 reference tablet can match or even beat the 3D performance of an Intel Haswell laptop with integrated graphics, despite the latter presumably burning many more watts.
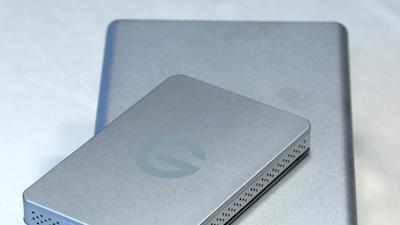
G-Technology G-DOCK ev: Thunderbolt and two removable drives for ultimate flexibility
G-Technology's new G-DOCK ev ($749.95 with two 1 TB G-DRIVEs) is a different animal. Think of having two removable, portable USB 3.0 drives that you can take into the field with you, and then being able to plug those drives into a Thunderbolt dock for high(er) speed transfer of data when you're back in the office or studio, and you've figured out the idea of this device. Unfortunately, the concept and reality of the G-DOCK ev are two separate things. The G-DOCK itself isn't exactly portable, measuring 7.87" x 5.12" x 3.54" and weighing 4 pounds, 5 ounces. The removable drives, however, are little self-contained units that are perfect for popping into the pocket of a jacket or a computer bag. The G-DRIVE ev USB 3.0 drives are quite a bit more compact, measuring just 5.14" x 3.29" x .65" each and tipping the scales at 10.2 ounces each. Those drives have a USB 3.0 port on the back of them for use in the field, as well as a SATA port covered by a small removable (and easily lost) plastic door. To use the drive in the G-DOCK, you remove the door and then slide the drive in until it locks. To remove the drive(s), there are two large buttons on the front of the device next to the drives. It should be noted that you don't just push the button to safely eject the drives, something that isn't immediately obvious. One would hope that G-Technology would have figured out a way to safely dismount the G-DRIVE ev drives automatically with a push of the button; instead, you need to be sure to drag the drive icons to the OS X trash to dismount them first. Likewise, G-Technology doesn't include any utilities for setting up the two G-DRIVEs as a RAID pair, instead pointing users in the direction of Apple's OS X Disk Utility. The G-DOCK can be set up as two individual drives or as one RAID 0 or RAID 1 array. For the purposes of testing, I used it as two individual drives for initial testing and then set it up as a RAID 0 (a stripe set of two 1 TB drives) for the final benchmark. Benchmarks Benchmarking of the G-Technology G-DRIVEs and G-DOCK ev was done with Intech Software's SpeedTools QuickBench 4.0 software. To ensure accuracy in testing, I performed a 100-cycle complete test. This subjects the drive to sequential and random read and write tests with file sizes from 4K to 100 MB, then graphically or textually displays that information to show the "sweet spots" for a specific drive or array. For example, if your work involves shuffling around a lot of very large files, you'll probably want a drive that has peak read/write speeds for files around your average file size. I first tested an individual G-DRIVE connected via USB 3.0. The standard tests (first four results) use nine different file sizes between 4 KB and 1024 KB. The large tests use transfer sizes between 2 and 10 MB, while the extended tests look at file sizes between 20 and 100 MB. These test results were not compared to any other devices, as TUAW has not recently tested any non-RAID devices with the QuickBench software. Sequential Read: 110.628 MB/Sec Sequential Write: 113.286 MB/Sec Random Read: 21.857 MB/Sec Random Write: 28.756 MB/Sec Large Read: 131.540 MB/Sec Large Write: 125.343 MB/Sec Extended Read: 135.542 MB/Sec Extended Write: 135.014 MB/Sec Next, I performed the tests on a G-DRIVE in the G-DOCK ev through a Thunderbolt connection: Sequential Read: 117.730 MB/Sec Sequential Write: 120.449 MB/Sec Random Read: 22.769 MB/Sec Random Write: 28.896 MB/Sec Large Read: 134.485 MB/Sec Large Write: 130.679 MB/Sec Extended Read: 135.313 MB/Sec Extended Write: 134.928 MB/Sec I found it odd that the differences in speed between USB 3.0 and Thunderbolt connections were negligible. Next, the two G-DRIVEs in the G-DOCK ev were set up as a RAID 0 volume approximately 2 TB in size, and benchmarks were run using a Thunderbolt connection: Sequential Read: 189.675 MB/Sec (140.504 MB/Sec for Drobo 5D) Sequential Write: 197.831 MB/Sec (93.245 MB/Sec for Drobo 5D) Random Read: 22.432 MB/Sec (116.435 MB/Sec for Drobo 5D) Random Write: 38.360 MB/Sec (70.410 MB/Sec for Drobo 5D) Large Read: 272.062 MB/Sec (341.327 MB/Sec for Drobo 5D) Large Write: 262.744 MB/Sec (282.060 MB/Sec for Drobo 5D) Extended Read: 266.927 MB/Sec (255.953 MB/Sec for Drobo 5D) Extended Write: 264.170 MB/Sec (262.864 MB/Sec for Drobo 5D) The RAID 0 benchmarks showed some interesting results. Random Read/Write of smaller-sized files was surprisingly slow, while the G-DOCK ev performed admirably when reading and writing larger files. This indicates that the RAID configuration would work well for use cases involving large file sizes. It should be noted, though, that once you create a RAID array (either mirrored or striped) with the two G-DRIVEs, you can no longer pop them out for portable use. Essentially, you need to decide ahead of time whether you want a pair of portable drives that you can pop out of a Thunderbolt dock or a Thunderbolt RAID 0 or RAID 1 array. That's why I think the G-DOCK ev is kind of an odd duck. For portable Thunderbolt drives, it's possible to get two 1 TB drives for about $300 -- much less expensive than the G-DOCK ev with its two 1 TB removable drives. If you're looking for Thunderbolt RAID setups, you can buy one of G-Technology's own 8 TB G-RAID arrays for about the same price as the 2 TB RAID 0 (or 1 TB RAID 1) G-DOCK ev -- but of course you lose the portability. Conclusion The G-Technology G-DOCK ev provides fast read/write of large files as a Thunderbolt RAID array and the removable USB 3.0 G-DRIVEs are reasonably fast as well. However, most users would be better served by selecting their most common use case -- need for large RAID storage or need for portability -- and purchasing a single solution that fits that need. The users would save money and most likely gain capacity over this odd "portable / RAID" hybrid solution. Pros Excellent construction, sturdy devices made of aluminum Relatively fast performer when reading and writing large files, although no faster than competing devices Cons Expensive compared to dedicated RAID arrays or separate portable drives Doors for removable drives are small and would be easy to lose No speed advantage of putting the removable USB 3.0 drives into the Thunderbolt dock Drives do not perform well with small file sizes Removable drives should dismount automatically when the drive button is pushed; instead, the drives need to be dismounted manually Who is it for? Due to the cost of the G-DOCK ev, it's relatively common performance, the fact that the removable USB 3.0 G-DRIVEs aren't any faster when placed in the Thunderbolt dock, and the fact that it's really an either/or solution (RAID or portability), we cannot recommend purchasing this product.

Drobo Mini rocks storage and speed in a small package
Take the ever-expanding storage capabilities of Drobo BeyondRAID storage, throw in some Thunderbolt, and put it all into a small box and what do you have? Drobo Mini (US$649 MSRP, available for much less online). To pack a lot of RAID-protected storage in a small space, Drobo chose to use 2.5" SATA laptop drives as the standard. There are four bays for drives in the Drobo Mini -- it comes empty, and you add drives of any capacity to fill 'em up. You can mix and match capacities, or even drop 2.5" SATA SSD or hybrid drives into the box for more speed. At this point, those 2.5" drives only come in capacities up to 1 TB, but as capacities increase in the future you'll be able to easily hot swap the "old" drives for more storage. The Drobo Mini won't take up a lot of room on your desktop, unlike its larger siblings. Size-wise, it's 7.3" wide x 1.8 " tall x 7.1" deep (187.2 mm x 44.6 mm x 180.0 mm), and weighs 2.2 lbs (1 kg) without the power supply and drives. As with the Drobo 5D I tested last month, the Drobo Mini comes with a separate slot on the bottom in which an optional mSATA SSD drive can be installed. The company calls it the Accelerator Bay, and the test device came without that drive installed. About the pricing: although the suggested retail price of the Drobo Mini is $649, it was available a few days ago on Amazon for just $318.99. Setup Setup of the Drobo Mini is incredibly simple. If you already have the Drobo Dashboard software installed on your Mac, you simply unpack the drive, remove the front door, slide in your drives, close the door, plug in the Thunderbolt or USB 3.0 cable and power, and then turn it on. After a quick format of the drive array, you're ready to roll. That entire process, including the formatting, took me about four minutes. The four drives I installed were 1 TB WD "Blue" drives. Set up with single disk redundancy (one drive can totally fail and be rebuilt without compromising the array), that provided 2.72 TB of storage with .91 TB used for protection of the array and 4.88 GB taken up for overhead. If I had set that up with dual disk redundancy (two drives can fail, be replaced, and be rebuilt without problems), I would have 1.81 TB of storage, 1.82 TB being used for array protection, and 3.25 GB chewed up for overhead. The device has two Thunderbolt connectors, but can also be used with USB 3.0. Cables are included in the box, so it's literally a plug-and-play storage solution. The two Thunderbolt ports are perfect if you wish to daisy-chain Drobo Minis and add in a couple of monitors. Benchmarks Benchmarking of the Drobo Mini was done with Intech Software's SpeedTools QuickBench 4.0 software. To ensure accuracy in testing, I performed a 100-cycle complete test. This subjects the drive to sequential and random read and write tests with file sizes from 4K to 100 MB, then graphically or textually displays that information to show the "sweet spots" for a specific drive or array. For example, if your work involves shuffling around a lot of very large files, you'll probably want a drive that has peak read/write speeds for files around your average file size. The tests were performed both with Thunderbolt and USB 3.0. Using Thunderbolt, the standard test results (nine different file sizes between 4 KB and 1024 KB) showed average speeds as follows: Sequential Read: 95.734 MB/Sec (140.504 MB/Sec for Drobo 5D) Sequential Write: 92.657 MB/Sec (93.245 MB/Sec for Drobo 5D) Random Read: 86.858 MB/Sec (116.435 MB/Sec for Drobo 5D) Random Write: 63.816 MB/Sec (70.410 MB/Sec for Drobo 5D) For the large test -- transfer sizes between 2 and 10 MB -- the average results were: Large Read: 242.674 MB/Sec (341.327 MB/Sec for Drobo 5D) Large Write: 283.218 MB/Sec (282.060 MB/Sec for Drobo 5D) And for the extended test -- transfer sizes between 20 and 100 MB -- the average results were: Extended Read: 198.521 MB/Sec (255.953 MB/Sec for Drobo 5D) Extended Write 207.001 MB/Sec (262.864 MB/Sec for Drobo 5D) For USB 3.0, the results were Sequential Read: 72.593 MB/Sec (99.533 MB/Sec for Drobo 5D) Sequential Write: 112.456 MB/Sec (111.509 MB/Sec for Drobo 5D) Random Read: 62.968 MB/Sec (94.895 MB/Sec for Drobo 5D) Random Write: 70.996 MB/Sec (80.605 MB/Sec for Drobo 5D) Large Read: 220.192 MB/Sec (217.975 MB/Sec for Drobo 5D) Large Write: 242.503 MB/Sec (219.885 MB/Sec for Drobo 5D) Extended Read: 184.446 MB/Sec (198.243 MB/Sec for Drobo 5D) Extended Write: 161.916 MB/Sec (228.985 MB/Sec for Drobo 5D) These results are all much, much better than what we saw for the first-generation Drobo Pro under FireWire 800. For those tests, there were only two results -- write and read speeds -- and they weren't that good. Write speed was 29.3 MB/Sec, while read speed was 46.0 MB/Sec. The Drobo Mini is much faster than the old Drobo Pro, especially when using a Thunderbolt connection. As you can see, most of the read and write speeds for both Thunderbolt and USB 3.0 are lower than they were for the Drobo 5D. However, the 5D tested had an mSATA drive installed for caching, while the Drobo Mini did not. If you need a really fast drive array, the Drobo 5D is probably more up your alley; if size is a constraint, consider the Mini but be sure to get an mSATA drive to install in the Accelerator Bay. Conclusion The Drobo Mini is a delightful compact update to the creative professional storage solution. It retains the ease of use and setup of the original Drobo products, but brings a surprising amount of speed to the game in a size that won't take over your desk. Stay tuned for our final review of a new Drobo product -- the Drobo 5N NAS array -- in the next week or two. Pros Easy setup and configuration Easily expandable storage; as drive capacities increase, drives can be replaced with higher capacity gear Can be set up for single or double-disk redundancy Drives are hot-swappable Dual Thunderbolt ports for daisy-chaining New, lower pricing Has accelerator bay for adding cache via mSATA SSD Cons May not be fast enough for video professionals Slight fan and drive noise (louder than the Drobo 5D) Who is it for? Anyone with a need for relatively fast, expandable, and reliable mass storage in a small physical footprint

iPad Air: Unboxing, first impressions and benchmarks
Today's the first day of availability for the new iPad Air, and after totally forgetting to order it online at 1 AM MT, I got onto the online Apple Store at around 7:30 AM to order one. After confirming that the model I wanted -- 32 GB, silver, AT&T -- was in stock at the Aspen Grove Apple Store in Littleton, CO, I pushed the button. I picked it up at around 11:30 AM, and was in and out of the store in about five minutes. I'm one of those sick individuals who tends to hold onto the old boxes for my Apple products, so I was able to do a quick size comparison with the 3rd-generation iPad and iPad mini. The box was the same height and thickness as that of the iPad, but not as wide. With that silliness out of the way, it was time to grab the scissors and actually open the box: I apologize for the video quality, but I get sooo excited with a new iPad. Some people like new cars, some people get excited about new clothes, I love new tech. It's when you first get your hands on the iPad Air that you realize just how good a job Apple did at trimming the weight. It weighs only about 6 ounces more than an iPad mini, as you'll see in the weigh-in pictures in the slideshow below. I found the display on the iPad Air to be slightly brighter than that of the 17-month-old 3rd-generation iPad at the same brightness setting, and it had a slightly warmer tint to it. There's a side-by-side image in the slideshow that demonstrates this. In terms of speed, the Air seems to be quite snappy. "Snappy" isn't a good quantitative unit of measure, so I installed Geekbench 3 on all three iPads to get a much better picture of exactly how fast they all are: Geekbench Score Comparison SIngle-Core Score Multi-Core Score iPad Air 1469 2675 iPad (3rd-Gen.) 262 494 iPad mini (1st-Gen.) 259 468 Yes, the iPad Air is FAST. All apps except Geekbench were shut down and the devices were restarted before running the benchmark. The device specs are as follows: Device Specifications Model iPad Air iPad (3rd-Gen.) iPad mini (1st-Gen.) OS Version 7.0.3 7.0.3 7.0.3 Processor A7 @ 1.39 GHz A5X @ 1.00 GHz A5 @ 1.00 GHz RAM 976 MB 988 MB 503 MB Storage 32 GB 32 GB 16 GB All in all, my initial impressions of the iPad Air are very favorable. I hope to do some additional tests in the near future for publication here on TUAW.

Intel Bay Trail benchmarks show big boost for Windows 8.1 and Android tablets
Things are changing at Intel. In the desktop world, the company is used to staggering its efforts with a "tick-tock" product cycle. First it manufactures an existing chip design at a smaller size of transistor ("tick") and then, usually a year later, it improves the architecture while sticking to the same transistor size ("tock"). Bay Trail, by contrast, is a mobile class chip that represents both a tick and a tock. It makes major changes on previous Clover Trail design, while also shifting from 32nm to 22nm transistors. A jump like that holds major promise, so we were keen to benchmark Bay Trail at the earliest opportunity. Intel allowed us into a hotel room in central London to do just that, using the highest-spec quad-core Z3770 chip inside a reference tablet, and the results look impressive. Read on for the stats and a quick assessment of what they mean.

Samsung reportedly boosting Galaxy Note 3 benchmark performance by 20 percent
Samsung drew criticism for inflating the benchmark scores of Exynos devices earlier in the year, but the company appears undaunted; it's reportedly boosting test numbers for other hardware as well. Ars Technica has discovered that the Snapdragon 800-based Galaxy Note 3 (and possibly the new Note 10.1) includes code that runs all CPU cores at full speed during certain benchmarks. The tweak gives the smartphone a minimum 20 percent higher score in any affected app, or enough to claim an artificially large advantage over an LG G2 using a similar chip. There may also be a graphics boost, Ars says. We've asked Samsung for its take on the findings. Whether or not the company responds, we don't envy its position -- it's hard to form an alliance devoted to accurate mobile benchmarking when you're accused of doctoring results.

MobileBench group aims to improve mobile benchmarking, recruits Samsung but lacks Qualcomm, NVIDIA
It's called MobileBench: an industry consortium planning to offer "more effective" performance assessments on mobile devices -- most likely centered on, but not limited to, Android. Unsurprisingly after recent developments, Samsung joins as a founding member, alongside Broadcom, Huawei, Oppo, and Spreadtrum. While that's who's in, who isn't? Well, both NVIDIA (responsible for the Tegra series of mobile chips) and the increasingly ubiquitous Qualcomm, which makes the Snapdragon mobile processor range. Between them, they power the likes of Microsoft's Surface series, Amazon's new Kindle Fire range, not to mention numerous flagship devices from LG, Samsung, Sony and Motorola. The group gathered for the first time yesterday in Shenzhen, China and outlined how it aims to offer more useful tools for mobile platform designers and "more reliable indices" for assessing user experience. MobileBench plans to establish impartial guidelines and a more sophisticated evaluation methodology for both its first benchmark tool, MobileBench and MobileBench-UX, for testing system-level applications. The benchmarking tool will assess hardware performance, including high-level processes like video and image viewing, camera use and other real-life use cases, with one of the primary aims being result consistency and less deviation between repeated tests. Another app is planned for consumer use in the future, likely similar to the benchmarking apps Engadget uses in its reviews. The bigger question is how much the consortium can achieve without wider adoption inside the industry -- it's apparently "actively seeking" more members.

iPhone 5s slaps down competitors in early benchmarks
Zach Epstein at BGR gives us a good, yet short summary of a rather lengthy (13 pages) review of the iPhone 5s posted on Anandtech by Anand Lal Shimpi. In his article, iPhone 5s slaughters its quad-core rivals in performance tests despite having "just" a dual-core CPU and 1 GB of RAM. Zach notes that this is the "most thorough [technical] review" to date. Shimpi's article quickly grew to 40 pages with the addition of user comments. Falling into the speeds and feeds trap when discussing mobile devices can be tricky, especially when the specs that smartphone vendors share most frequently only paint a small piece of the picture. It's easy to look at things like CPU cores and clockspeeds and make assumptions, but dozens of factors contribute to a smartphone's performance. --Zach Epstein Shimpi compared the new iPhone with devices from Samsung, LG, HTC and Motorola. Even though the iPhone 5s is powered by a 1.3 GHz dual-core 64-bit A7 processor, Apple bested the other devices in every performance test. Shimpi used JavaScript and HTML5 browser tests for CPU performance. His A7 GPU tests resulted in his comment, "The A7's GPU performance is also insanely good." His 13-part review is extremely technical in places, so good luck with the technical details -- I admit it lost me in places. To Shimpi's credit, almost every fact is accompanied by a graphical chart showing his results. The iPhone 5s is the first Apple device (and consumer device in the world) to ship with a PowerVR Series 6 GPU. The G6430 inside the A7 is a 4-cluster configuration, with each cluster featuring a 16-wide array of SIMD pipelines. -- Anand Lal Shimpi The only negative bit I read that I think is worth noting for a general user is how much wear his Apple case showed after only one week of use. That photo appears on page one of Anand Lal Shimpi's review. Many companies make cases, so you might be best off not purchasing the Apple leather iPhone 5s case. [via BGR] Related Articles The iPhone 5c Review (AnandTech) iPhone 5s review (Engadget) iPhone 5s Review: Apple's Latest Smartphone Goes For (And Gets) The Gold (TechCrunch)

3DMark arrives for iOS, allows you to benchmark across platforms
Good benchmarking apps on mobile are few and far between, especially on iOS. But that's all set to change today with the release of 3DMark from Futuremark. 3DMark is one of the world's most popular cross-platform benchmarking apps, and now that it's available on iOS, it will allow users to benchmark across smartphones and tablets running iOS, Android, Windows or Windows RT. As noted by Futuremark in the release notes, 3DMark offers three tests: Ice Storm is for device-to-device comparisons of mainstream mobile devices. Ice Storm is an OpenGL ES 2.0 benchmark test that uses fixed off-screen rendering at 720p, then scales the output to fit the native display resolution of your device. Ice Storm includes two graphics tests designed to stress the GPU performance of your device and a physics test to stress its CPU performance. Ice Storm Extreme is for device-to-device comparisons of high performance mobile devices. Ice Storm Extreme raises the off-screen rendering resolution to 1080p and uses higher quality textures and post-processing effects in the graphics tests to create a more demanding load for the latest smartphones and tablets. Ice Storm Unlimited is for chip-to-chip comparisons of the hardware inside your device without vertical sync, display resolution scaling and other operating system factors affecting the result. In Unlimited mode the rendering engine uses a fixed time step between frames and renders exactly the same frames in every run on every device. The frames are rendered in 720p resolution "offscreen" while the display is updated with small frame thumbnails every 100 frames to show progress. 3DMark will run on any iOS device that can run iOS 6 or above -- excluding the fourth-generation iPod touch. It requires 512 MB of RAM and 174 MB of free space. 3DMark is a free download.

Windows 8 found to skew benchmark results on overclocked hardware
Overclocking may yield impressive benchmark results, but it turns out scores from Windows 8 PCs may not be reliable. The management at overclocking community HWBOT has discovered that tests provide inaccurate stats when then CPU base clock frequency is fiddled with from within the OS. Hardware-based real-time clocks (RTCs) help keep accurate track of time, but the operating system's timekeeping somehow slows down or ramps up when processing speeds are tweaked. When underclocked by six percent, the outfit's Haswell-infused system lagged 18 seconds behind actual time, fooling the benchmark into a higher score since it seemingly finished in a shorter period of time. Conversely, a boost to CPU speeds results in a lower mark as the internal timepiece ticks away faster than usual. However, modifying processor speeds at boot time avoids these issues. As a result of the revelation, HWBOT is no longer accepting benchmarks from computers running the eighth iteration of Ballmer and Co.'s software, and will invalidate those already in its database. "Simply no benchmark – not even 3DMark – is unaffected by Microsoft's RTC design decisions," the outlet adds. The timing issues are said to stem from Windows 8's support of disparate hardware setups, including embedded and budget PCs that don't have a fixed RTC. If you'd like to see the inconsistencies for yourself, head past the break for video proof.


