EVE Online graph shows connection between production and destruction

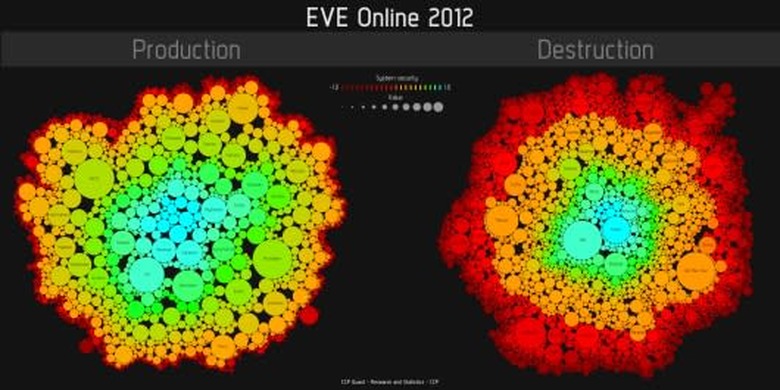
According to CCP, EVE Online is a constant feedback loop of production and destruction, each feeding off of each other in enormous amounts. The studio posted a colorful infograph that shows how much of each side was done in the game last year and under what level of system security.
The devs explain the key difference between the two sides: "Most wars take place in the outermost regions of space (red on the scale), far beyond the safety of the high security regions of the Empires (light blue on the scale). The most favorable conditions for production are a mix of close proximity to major market hubs and the safety provided by the high security regions surrounding them. This visualization tells this story, showing the total produced- and destroyed-value of end products (ships and modules), where production mainly takes place in higher-security space (yellow to blue) and the majority of destruction takes place in low- or null-security space (orange to red)."