NASA reveals pollution maps gathered by the TEMPO space instrument
The agency is testing the tool before going fully operational in October.
NASA has published the first maps from its new space-based pollution instrument, TEMPO (Tropospheric Emissions: Monitoring of Pollution). Although you won't be shocked to learn it reveals higher pollution rates in metropolitan areas, the tool can help scientists better study North American air quality on an hourly basis. "Neighborhoods and communities across the country will benefit from TEMPO's game-changing data for decades to come," NASA Administrator Bill Nelson wrote in a press release today.
The instrument, which launched in April and orbits at 22,000 miles above the equator, can help scientists better study the health impacts of pollutants "at the neighborhood scale." It can take hourly measurements, providing insights into the effects of rush-hour traffic, smoke and ash from forest fires and how fertilizer affects farm country. The tool measures sunlight bounced off the Earth's surface, atmosphere and clouds. "Gases in the atmosphere absorb the sunlight, and the resulting spectra are then used to determine the concentrations of several gases in the air, including nitrogen dioxide," NASA explained.
NASA says it will share its data with partner agencies, including the Environmental Protection Agency (EPA) and the National Oceanic and Atmospheric Administration (NOAA). Since taking the first measurements earlier this month, teams have been busy checking and calibrating the satellite's systems ahead of regular hourly operations kicking off in October. NASA views the data as a boon in its quest to reach the Biden administration's climate goals.
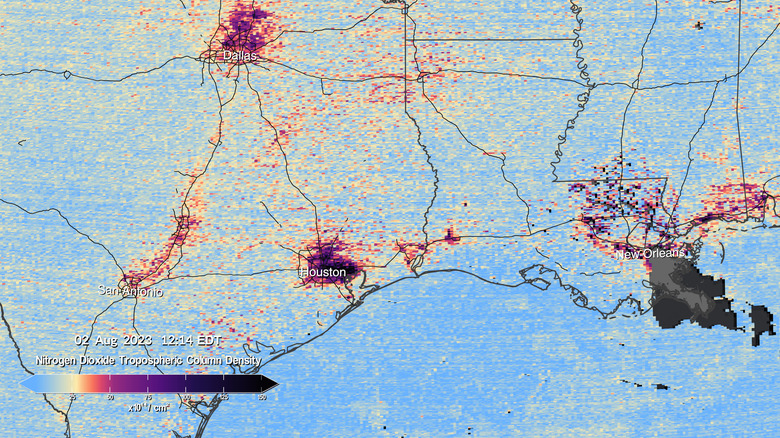
The instrument beamed back its first images on August 2nd, showing the I-95 corridor in the Northeast (New York, Philadelphia and Washington, DC areas), a slice of the South (central and eastern Texas stretching to New Orleans) and a section of the Southwest (Los Angeles to Las Vegas). As expected, the maps reveal heavy nitrogen dioxide density over cities and their suburban sprawl.
"Detailed views of three regions show high levels of nitrogen dioxide over cities in the morning, and enhanced levels of nitrogen dioxide over major highways," NASA wrote today. "As the day progresses, the morning pollution often dissipates. Later in the afternoon, it will rise again as the cities enter their second rush hour of the day."
"This summer, millions of Americans felt firsthand the effect of smoke from forest fires on our health," said Nelson. "NASA and the Biden-Harris Administration are committed to making it easier for everyday Americans and decisionmakers to access and use TEMPO data to monitor and improve the quality of the air we breathe, benefitting life here on Earth."