Second Life private simulator data, December 2006 to May 2009

It's been widely grumbled about that Linden Lab has stopped publishing some key Second Life economic and service statistics, such as the number of non-mainland simulators (that is, those that are privately owned). Well actually,as it happens, that isn't entirely true, thanks to the wonders of automation.
The data was culled from the Second Life Web-site, where these things go, quite some months ago but automation is a funny thing. Linden Lab's systems kept publishing the data, and my own automated systems kept collecting it. So, despite a months-long blackout of the data it all continues to pile up in my databases, with the reliability and patience that only machines possess.
Here's a larger version of the thumbnailed image. You can click on it for the largest size.
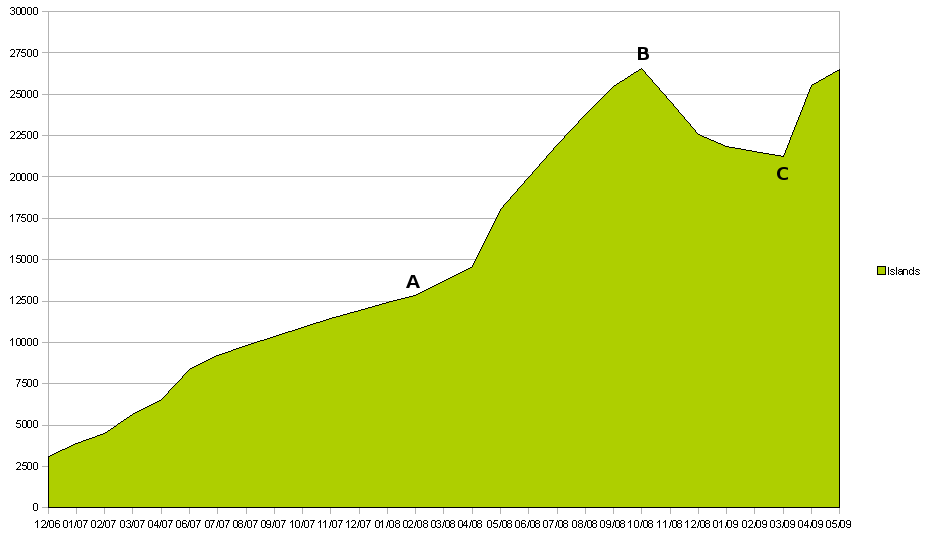
Here are our key labels along the timeline:
A – this is where Openspaces simulators were announced as a generally available product. Simulator purchases immediately begin to rise, and the following month, they take off. There's barely any slackening before
B – This is where Linden Lab announces the change to products and pricing in October 2008. From a peak of 26,539, the first ever monthly drop is recorded, with the fall finally bottoming out at
C – The decline stops here with 21,246 in March 2009, followed by an immediate jump of a full 4,281 simulators for April, and a further 955 for May, the last point on our chart.
Clearly the 2008 Openspaces product was popular. The curve looks like it would have easily topped 30,000 simulators by the end of 2008. The slight slackening in the rate was due to the announcement of specification and pricing changes partway through 2008, followed by the sharp decline in total simulator numbers, as simulators were abandoned or consolidated. Because of the announcement, October 2008 didn't have as much sell-through of simulators.
April 2009 is something of a mystery. With a net loss of 304 simulators in March 2009, suddenly there's a jump to a net gain of 4,281 for April 2009, before returning to a pre-Openspaces growth rate for May 2009.
That large jump for April is certainly intriguing. It isn't at all clear what it indicates. We're pretty sure that it isn't a data error, but we're really not sure what it actually represents. Looking at the raw data, 3,608 new non-mainland simulators suddenly appear on or about 17 April, following a lackluster fortnight. (June will end almost 10,000 simulators up from the end of March)
It's possible that some of those sims belong to Zindra, the new adult continent, and aren't being counted correctly as mainland sims, but that can't be the whole story. Zindra – we believe – just isn't that big.
Linden Lab could be mirror-testing simulators, running a second copy of the simulator on different software/hardware, but the same inputs and validating new systems that way, but again, the number seems far too large for that.
Our best guesses at the moment are that there is either a significant change to the way simulators are being categorized, and some or all of the simulators formerly counted as the mainland estate are no longer being counted as mainland sims, or that there is some very large deployment of simulators going on that we don't know about, and perhaps cannot yet see.
What cannot be reliably inferred is that the data represents a recovery ... at least not yet. The anomalous surge in mid-April pretty much squashes positive interpretations of the data, until more information comes to light. The data could represent a real recovery, or it could just be QA or Systems Engineers mucking about, or some secret project that the Lab has going.
Got your own theory? We'd love to hear it!
 | Are you a part of the most widely-known collaborative virtual environment or keeping a close eye on it? Massively's Second Life coverage keeps you in the loop. |
