Moneyball comes to the NHL with ProPuck Wizard

Billy Beane with the Oakland A's earned the most attention for his early use of analytics in setting up a line-up and running a major league baseball team. Now more and more sports are employing front office personnel with strong statistical and math backgrounds. ProPuck Wizard, a free universal app, now makes it possible for even casual fans to study and analyze their favorite NHL teams and try to discover what is responsible for the team's success or failure. ProPuck Wizard works on IOS 4.3 or later and makes available to fans a thorough breakdown of NHL team and league statistics that goes way beyond what fans would normally find available. Here is a breakdown of just some of the stats available:
Tracks teams performance and standings by points, win percentage, and momentum
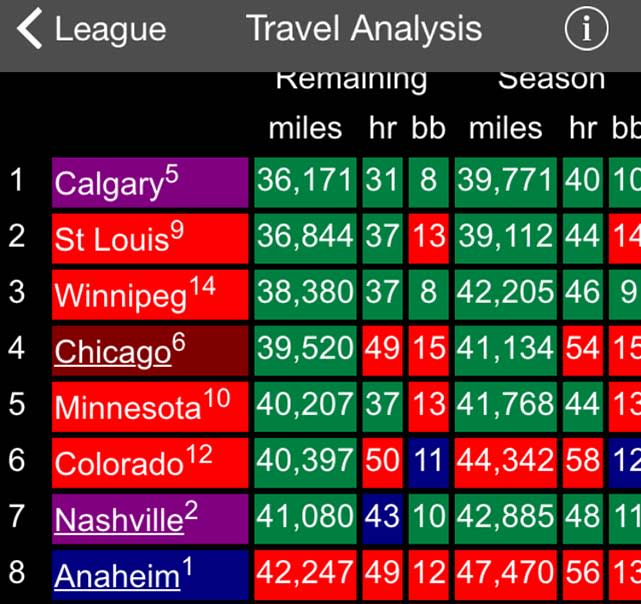
Travel analysis including distance travelled, time zones, and back to back games
Goal type analysis including even strength, power play, and short handed
Shooting analysis of shots, shot percentage, and save percentage
Game match-up analysis for past and future games
Complete home/away/aggregate customizable game results
All of these statistical breakdowns are updated each day so they are always up to date. In the Help section users will find explanations for all of the breakouts and how they are calculated.
The breakout of season long travel for each of the teams demonstrates some numbers that might be important as the season progresses. Western Conference teams travel a much greater distance over the course of the season. All of the Eastern Conference teams are in the Eastern time zone so the distances between cities is relatively close. The only two teams that will travel more than 40,000 miles are Florida and Carolina. Meanwhile all but two of the Western Conference teams will exceed 40,000 miles in travel this year most by several thousand miles. Arizona and Dallas log the most air miles since the are both way south of the other teams. All those extra miles means longer flights after games and getting to bed much later. This could impact a team's performance at certain points of the year.

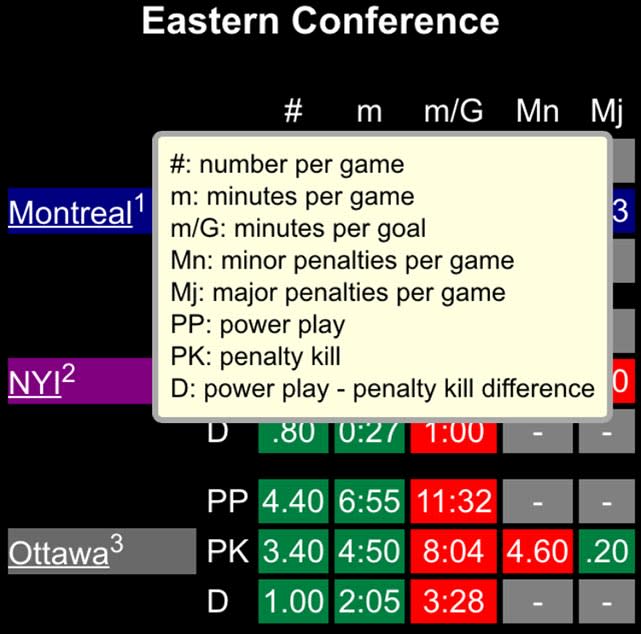
The statistic breakdowns are all color coded. Green numbers mean the team is performing above the league average, red designates areas where teams are below the league average and the blue numbers mark the points where teams are right at the league average. That makes if very easy to see just how your team is doing as you go through the breakouts. All the number columns have headers which can be confusing but a single tap on the header brings up a table with an explanation of each header.

If you are kind of a stat-head and really enjoy investigating all areas of performance by your favorite team in an effort to find the reasons for success or failure this app is for you. I am sure you will spend hours on ProPuck Wizard pouring through the numbers and forming your own conclusions on why your team should win the Stanley Cup.

