TED founder thinks big data needs a big makeover

Richard Saul Wurman isn't a fan of President Barack Obama's push for data.gov, an online repository for big data. "That's just politicians talking," the 79-year-old TED (technology, entertainment, design) conference founder told me. "I think there will be a pushback saying, 'We don't understand all this fucking data.'" The way Wurman sees it, that bulk collection of raw information has no value without a creative means of diagramming, mapping and comparing it all in a way that gives it meaning. "[You] have to have it in a form that you can understand. They're leaving that step out," he said. It's that approach to the organization of data that has directly informed the creation of Wurman's high-tech information-mapping project, Urban Observatory.
"He thinks big data is bullshit; it's like [carbon] atoms. You could either make a nuclear bomb or a bouquet of flowers with them. It's not helpful," said Dan Klyn, co-founder of Michigan-based information-architecture firm The Understanding Group and Wurman's biographer. "Some of the rah-rah-rah about big data is how precise and accurate it is," he said. "Precision and accuracy are not in a causal relationship with understanding."
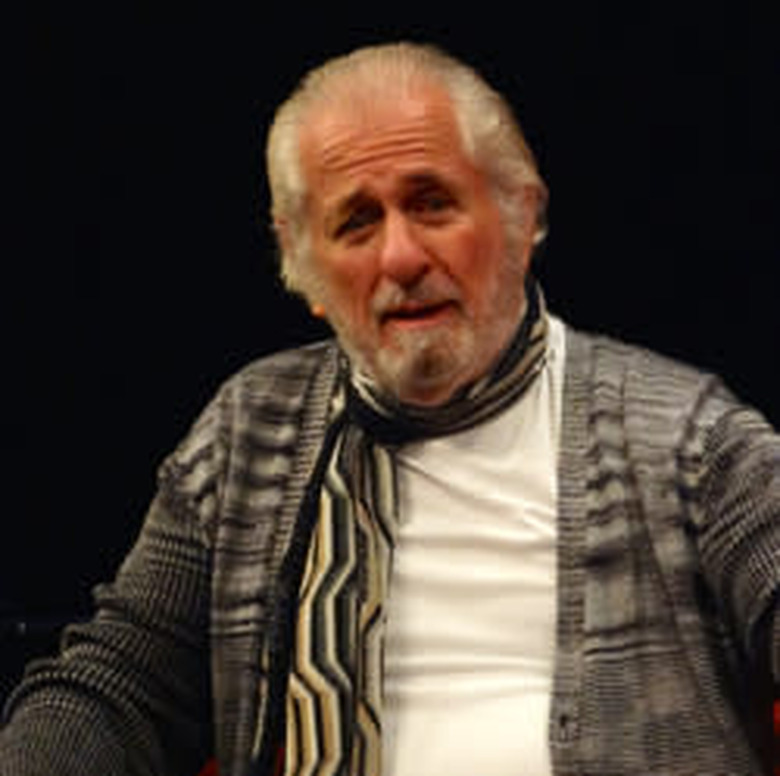
I recently listened to Wurman (pictured lower-left) give a keynote speech at West Michigan Design Week and here's what I learned: Earth's largest mammal, the blue whale, has a tongue the size of a school bus; it has a heart the size of a Volkswagen Beetle and an aorta that's big enough to swim through. Speaking of the VW Beetle, the first one rolled off the assembly line around the same time as the first Toyota, which, incidentally, happens to be around when Germany allied with Japan to form the Axis Powers. Oh, and that's the same time frame during which radar was invented. It's this type of instant association, linking data to other relevant bits of data, that Wurman finds more useful than simply telling someone that the blue whale's heart weighs 1,300 pounds.
That need for data comprehension is the driving force behind Wurman's ambitious Urban Observatory project. And what's more, it's actually an extension of something he thought of more than 40 years ago when he edited a 1971 issue of Minnesota's Walker Art Museum publication Design Quarterly. Wurman's idea at the time was to create a museum-like exhibit that would allow anyone to learn about and understand the makeup of different cities around the world based on a common set of comparable data. It wasn't until last year, however, that available technology finally caught up with his vision and Wurman could launch the project.
Wurman's idea was to create a museum-like exhibit that would allow anyone to learn about the makeup of different cities around the world based on a common set of comparable data.
Urban Observatory is a joint effort including Wurman, Jon Kamen from Radical Media (the production house responsible for Mad Men's pilot episode) and Jack Dangermond of Esri, a geographic information system (GIS) giant. It aims to make the world's wealth of city data both useful and interactive. By design, the system divides available data into five big categories (i.e., work, movement, people, public and systems), plus a handful of sub-categories. It then transforms digital map-related jargon, like georeferencing and clips, into information that anyone could understand.
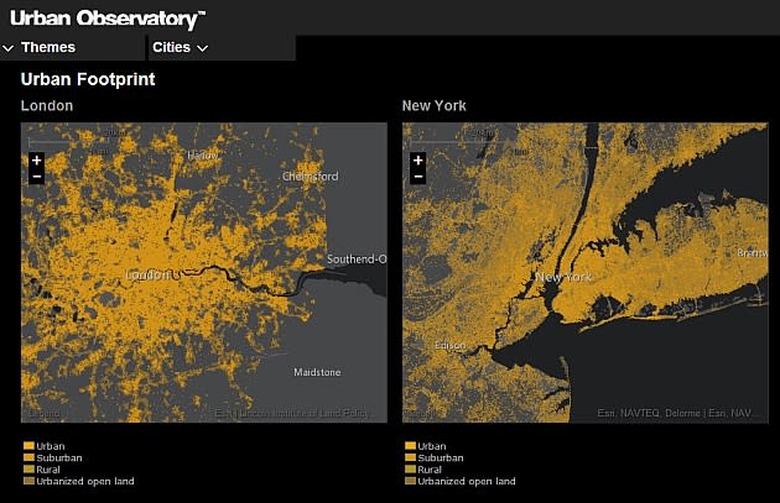
The key to Urban Observatory, Wurman told me, is that everything stays on the same scale at the same time — something its founders claim hasn't been done before. Let's say, for example, a new job meant you had the choice of moving anywhere in the world, and you wanted to find an area where your kids would have the best chances of making new friends. By referencing Urban Observatory, a user would be able to look at a map of Los Angeles and see which neighborhood has the highest youth population density. Zooming in even deeper into a specific neighborhood would trigger comparison maps of other cities you've selected to scale accordingly. It's a function Wurman believes will allow users to make an informed apples-to-apples comparison. You'll even be able to map how far it is to get to a park from any point, in any city. "It's amazing how different the cities are [for that]," Wurman told me.
Future updates to Urban Observatory's data set are limited only by what a city is willing to provide, which, it turns out, is surprisingly little. "If given the choice, a bureaucrat will keep things private," Wurman said. "It's a struggle getting information. That's why we only have the cities we have." His partner Dangermond has most, if not all, of the relevant GIS data (e.g., information about landfill locations, coastal development and agricultural expansion) at his fingertips, but can't make use of it unless local governments give the green light.
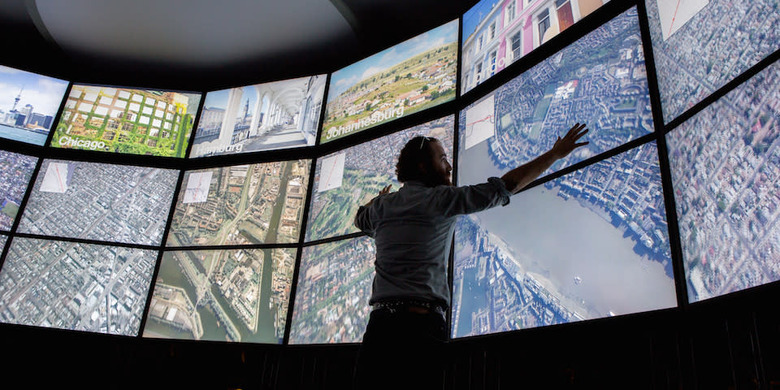
A non-interactive prototype of the Urban Observatory project made its debut at the Esri user conference last year in San Diego with datasets from 10 major cities including Chicago, Hamburg and Abu Dhabi. Wurman said that the number will jump to 50 cities at this year's Esri conference in July, and then to 78 next February. The initial exhibit consisted of large LCD panels stacked three high, in a roughly 30-foot-wide arc. "It looked great and ambitious. People were wowed by it, but you couldn't understand anything," Wurman told me. "It was too much information to understand at one time."
"Everything I do is something I do for myself," Wurman said. "I don't really give a fuck about the world; I'm just trying to understand things better."
Which is why the installation will change when it debuts at the Smithsonian Institute come February 10th, 2015. Wurman has reduced the size down to three 15-foot-wide "pods," each with its own interactive navigation display. In a lot of ways, it's like the Urban Observatory's web app, which, for now, is the only way you can fiddle with the data. "Anybody at anyplace in any city could probably afford it. Or a university can afford one and have it there and have it updated all the time from the cloud," Wurman said. He likened the Urban Observatory to a new type of museum, one filled with ideas and information instead of physical objects; one that's the same everywhere, at all times around the world and curated by data sitting on servers in Esri's San Diego offices. "It'll keep on going and getting better, but eventually it'll reach a conclusion of something I started when I was quite young," he said.
You might think that Wurman's involvement with Urban Observatory, or information architecture in general, is a type of philanthropy or even a way to help the world. But that's not the case. Wurman is nothing if not unapologetically selfish with his motives and quest for knowledge, and if someone else benefits along the way, so be it. "Everything I do is something I do for myself," he said. "I don't really give a fuck about the world; I'm just trying to understand things better."
[Image credit: Esri]